BLOG • Apr 14, 2026
The Behaviours of Organisational Collaboration
A Framework for Measuring, Analysing, and Improving How Teams Work Together
From Measurement to Meaning
Improving collaboration requires a way to measure it, visualise it, and to understand the behavioural nuances that sit beneath the numbers.
Measurement without interpretation produces dashboards that no one acts on. Interpretation without measurement produces insight that no one can verify. This framework bridges the two.
The foundation is a set of organisational network types: operational, social, and strategic, each measured through simple, scaled questions that ask people how they experience collaboration across their organisation. These are factual and quantitative: they produce scores that can be compared across teams, tracked over time, and made visible to leadership. They answer the question: how strong is collaboration here?
But a score alone does not explain itself. A team that scores low on information networks may be hoarding knowledge deliberately, or it may be overwhelmed and unable to share, or it may not know what other teams need from it. The same score, three entirely different problems, three entirely different interventions. To move from diagnosis to action, we need qualitative data, the stories people tell, the frustrations they voice, the patterns they describe in their own words, that substantiates and gives meaning to the quantitative picture.
It is in these qualitative nuances that real patterns begin to emerge. Patterns that are experienced by teams every day but rarely named: the meeting that always stalls at the same point, the handoff that consistently drops, the decision that gets revisited endlessly, the initiative that everyone supports in principle but no one drives in practice. These are not random occurrences. They are the surface expressions of deeper behavioural dynamics, habits of interaction, often unconscious, that shape how teams work together.
This framework identifies eight such behaviours. Each one connects directly to the network types it most affects, providing a bridge between what the quantitative data reveals and what the qualitative data explains. Once we have identified the behavioural patterns at play, we can connect them back to the actual activities teams engage in, consciously or unconsciously, that may be hindering collaboration and affecting both local team performance and the organisation’s collective performance.
The steps to effect sustainable change are as follows:
Diagnose: using network scores to identify hotspots, make collaboration patterns visible and identify where the opportunities lie.
Design: using qualitative data (free text feedback for each network type) to understand the behavioural patterns driving the scores.
Develop: a shared language of common behaviours to name what is happening, surface the paradoxes involved, and design interventions that address root causes rather than symptoms.
The Framework
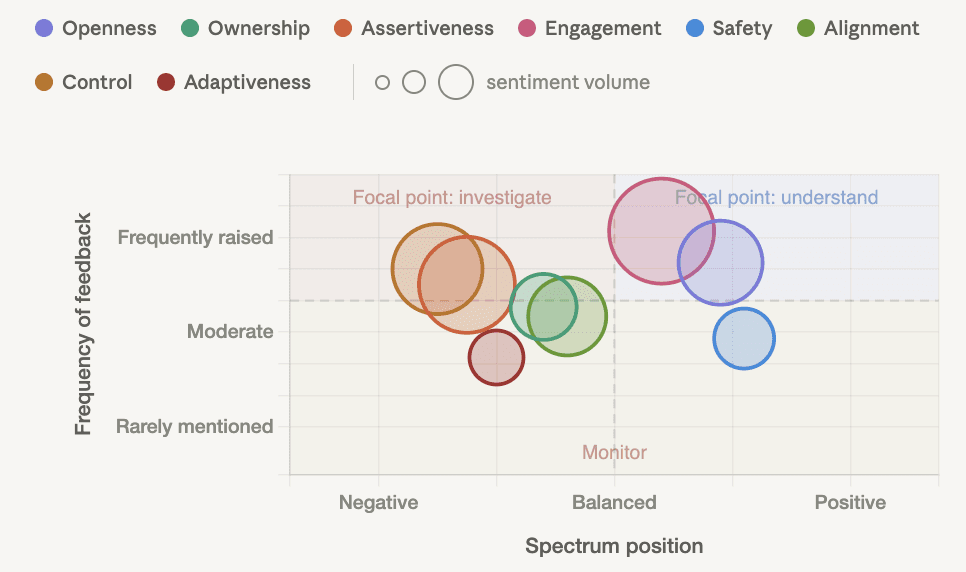
Collaboration between teams is not a single skill. It is a system of interdependent behaviours, each operating on a spectrum from productive to destructive, and each capable of producing unintended consequences when pushed too far in either direction.
This framework identifies eight core behaviours that shape how teams collaborate within organisations. Each behaviour is mapped to the organisational network types it most directly affects: operational networks (information, problem solving, and project management), social networks (feedback and trust), and strategic networks (clarity and innovation).
Every behaviour exists on a bipolar spectrum. The framework resists the temptation to define one end as good and the other as bad. Instead, it recognises that each pole serves a purpose, and that the right position depends on context, the team’s function, the organisation’s maturity, and whether one is optimising for local team performance or collective organisational outcomes. Most importantly, every behaviour carries a paradox: taken too far in the ‘positive’ direction, it produces the very dysfunction it was meant to prevent.
Connecting the Network to Behaviour.
The Cophi seven network sub-types are organised below into the top level categories of Operational, Social and Strategic collaboration.
Operational | Social | Strategic |
Information Networks | Feedback Networks | Clarity Networks |
Problem Solving Networks | Trust Networks | Innovation Networks |
Project Mgmt Networks |
The Behaviours
1. Openness
Spectrum: Radical transparency ↔ Total secrecy
Primary networks: Information, Clarity, Feedback
Openness governs how freely information, knowledge, and intent flow between teams. It is the behaviour most directly responsible for the health of information networks and the clarity with which strategic direction is understood across an organisation. Without openness, teams operate on assumptions. With too much, they drown in noise. Openness also underpins feedback networks: honest, constructive feedback requires a willingness to share perspectives that may be uncomfortable.
The Paradox
An organisation that celebrates transparency can inadvertently create paralysis. When every decision, draft, and data point is shared in real time, teams spend more energy processing information than acting on it. Premature exposure of work-in-progress invites interference before ideas have matured. Conversely, teams that restrict information flow to protect focus can starve partner teams of what they need. The deepest paradox is that openness about problems can trigger control responses from leadership, tighter processes, more oversight, which then reduces the safety people feel to be open in the first place.
Example: A product team shares its roadmap openly across the business. Sales begins making promises based on draft features. Engineering faces pressure to deliver uncommitted work. The team learns to share less, and within six months, other departments complain they are being kept in the dark. The organisation oscillates between over-sharing and under-sharing without finding a stable middle ground.
2. Ownership
Spectrum: Total absorption ↔ Complete abdication
Primary networks: Project Management, Problem Solving
Ownership determines who carries responsibility for outcomes, particularly when work crosses team boundaries. In project management networks, clear ownership ensures that interdependent deliverables have someone accountable. In problem solving networks, ownership determines whether surfaced problems actually get resolved or simply get discussed. The critical distinction is between owning your team’s contribution and owning the collective outcome. Most organisations incentivise the former and hope the latter follows. It rarely does.
The Paradox
When one team takes strong ownership of a cross-team initiative, other teams often step back, assuming the work is handled. Ownership thus creates the very abdication it was meant to prevent. Meanwhile, the owning team accumulates unsustainable workload and resentment. The opposite failure is equally common: when ownership is distributed across many teams, it effectively belongs to no one. Shared ownership sounds collaborative but often produces a diffusion of responsibility where everyone assumes someone else is driving.
Example: A transformation programme is nominally co-owned by three departments. Each assumes the others are handling stakeholder communications. Six months in, the executive sponsor discovers that no external stakeholders have been briefed. Each department points to the shared ownership model as the reason, and to each other as the party that should have acted.
3. Assertiveness
Spectrum: Domination ↔ Submission
Primary networks: Problem Solving, Innovation
Assertiveness shapes whose voice is heard, whose expertise is applied, and whose solution prevails when teams collaborate. It is the power dynamic at the heart of problem solving networks. In innovation networks, assertiveness determines whether new ideas survive scrutiny or are killed by dominant voices before they develop. Critically, assertiveness also captures authority dynamics, the relationship between teams and the hierarchical structures above them. A team may be highly assertive with peers but entirely submissive to leadership, or vice versa. Both patterns distort collective outcomes.
The Paradox
Functions with high domain expertise, legal, finance, compliance, often need to assert boundaries that feel obstructive to other teams. Their assertiveness protects the organisation but slows delivery. Reducing their assertiveness increases speed but introduces risk. The paradox intensifies between functions whose local goals are inherently in tension: sales needs flexibility, legal needs control; innovation needs permission to fail, governance needs assurance of success. Neither side is wrong. The tension is designed into the system, and assertiveness is the behaviour through which it plays out.
Example: A compliance team consistently blocks product launches until documentation meets regulatory standards. The product team views them as obstructive. Leadership pressures compliance to be more ‘collaborative.’ Compliance softens its stance. A product launches without adequate checks. A regulatory finding follows. Compliance reasserts itself more forcefully than before, and the relationship deteriorates further.
4. Engagement
Spectrum: Hyperinvolvement ↔ Total disengagement
Primary networks: All networks
Engagement is the energy teams invest in cross-boundary work. It is the volumetric dimension, how much attention, participation, and discretionary effort flows into collaborative activity versus local priorities. It activates every network type: information only flows if people engage with it; problems only get solved if people show up; projects only deliver if contributors are genuinely present rather than nominally assigned. Engagement also captures the distinction between genuine and performative collaboration, between teams that participate because they believe in the collective goal and those that attend because they are required to.
The Paradox
Organisations that value collaboration tend to multiply the forums, meetings, and coordination mechanisms through which it happens. Each one demands engagement. Collectively, they create collaboration overload, a state where people are so busy collaborating that they have no time to do the work they are collaborating about. The result is either burnout (people try to sustain engagement and exhaust themselves) or withdrawal (people disengage to protect their capacity, but do so quietly to avoid being seen as uncommitted). The paradox is that the organisational desire for more engagement is often the direct cause of disengagement.
Example: A global firm introduces cross-functional squads to improve collaboration. Each employee now belongs to their functional team, a squad, and two working groups. Calendar utilisation hits 90%. Deep work collapses. Quality drops. Employees start declining meetings but sending updates by email, technically engaged, practically absent. The firm diagnoses a ‘culture problem’ and introduces more engagement initiatives.
5. Safety
Spectrum: Complacency ↔ Hypervigilance
Primary networks: Trust, Feedback
Safety is the felt environment in which collaboration occurs. It determines whether people can surface problems, challenge ideas, admit mistakes, and offer honest feedback without fear of consequences. It is not the same as trust, which describes a bilateral relationship. Safety is a collective property, an emergent condition created by many trust relationships, leadership behaviours, and organisational norms acting together. Safety is the enabling condition for every other behaviour in this framework. Without it, openness becomes guarded, assertiveness becomes silence, and feedback networks collapse into polite agreement.
The Paradox
When safety is high within a team, it can create a warm interior that is experienced as exclusionary by outsiders. The team feels psychologically safe, but only with each other. Cross-team interactions remain cautious, formal, and low-trust. Equally, an environment that feels safe for the majority may feel deeply unsafe for minorities, dissenters, or newcomers whose perspectives differ from the prevailing consensus. At the extreme, very high safety produces complacency: teams stop challenging each other because the atmosphere is so comfortable that conflict feels unnecessary. Groupthink sets in. The organisation feels healthy from the inside while slowly losing its capacity for critical thought.
Example: A leadership team prides itself on psychological safety. Meetings are warm, supportive, and consensus-driven. A new member raises a concern about strategic direction. The response is gentle but dismissive, the group closes ranks around the existing view. The new member learns that safety here means safety to agree. Within a year, they stop raising concerns. The team’s blind spot becomes an organisational blind spot.
6. Alignment
Spectrum: Lockstep conformity ↔ Total fragmentation
Primary networks: Clarity, Innovation
Alignment captures whether teams share a common understanding of what the organisation is trying to achieve and how their work contributes to it. It is the primary behaviour of clarity networks and a critical enabler of innovation networks, where new ideas need strategic context to be evaluated and prioritised. Alignment operates on two levels: local (does the team understand its own goals?) and collective (does the team understand how its goals connect to others’?). Most organisations measure local alignment well. Collective alignment, the understanding of how my work connects to yours, is where collaboration most commonly breaks down. This dimension also captures mission and belief: do people understand the direction, and do they care?
The Paradox
Strong alignment can suppress the productive tension between functions that organisations actually need. When sales, engineering, and finance are perfectly aligned, it often means one function’s perspective has won and the others have capitulated rather than genuinely integrated. Paradoxes between functions are not alignment failures, they are design features. An organisation needs its risk function to pull in a different direction from its growth function. Forcing alignment between them doesn’t resolve the tension; it hides it, until it resurfaces as a crisis. The real skill is distinguishing between destructive fragmentation (teams pursuing incompatible goals without realising it) and productive tension (teams pursuing different goals that collectively serve the whole).
Example: A technology company cascades OKRs from the executive team to every department. On paper, alignment is perfect, every team’s objectives ladder up to the corporate strategy. In practice, the infrastructure team’s reliability goals directly conflict with the product team’s speed goals. Both are locally aligned to the strategy. Neither can deliver without the other compromising. The OKR system cannot surface this tension because it was designed to show alignment, not to reveal necessary paradox.
7. Control
Spectrum: Centralised command ↔ Distributed autonomy
Primary networks: Project Management, Problem Solving
Control captures where decision rights sit, who can say yes, who can say no, and who sets the rules of engagement between teams. It is distinct from both assertiveness (who speaks up) and ownership (who takes responsibility). A team can feel empowered, vocal, and accountable while having no actual control over the decisions that shape their work. This gap between felt empowerment and real decision authority is one of the most common sources of organisational frustration. Control also determines the pace at which collaborative work can move. Centralised control creates bottlenecks but ensures coherence. Distributed control enables speed but risks fragmentation and duplication.
The Paradox
Organisations frequently declare a desire for empowerment and autonomy while retaining centralised control over budgets, headcount, technology choices, and strategic priorities. Teams experience this as a double bind: they are told to take ownership but lack the control to act on it. The result is either learned helplessness (teams stop trying to make decisions because they know they’ll be overridden) or shadow governance (teams make decisions unofficially and avoid seeking approval, creating risk the organisation cannot see). The paradox is sharpest in regulated industries, where external requirements demand centralised control but operational effectiveness demands local autonomy. Neither pole is viable; the organisation must hold both simultaneously.
Example: A bank’s digital team is told to ‘move fast and innovate.’ Every technical decision requires sign-off from a central architecture board that meets fortnightly. The team builds workarounds, deploying to unofficial environments, using unapproved tools, to maintain momentum. When a security incident occurs in one of these shadow systems, leadership responds by tightening control further. The team’s official velocity drops to near zero. Innovation moves entirely underground.
8. Adaptiveness
Spectrum: Constant reinvention ↔ Rigid repetition
Primary networks: Feedback, Innovation
Adaptiveness captures whether teams learn from collaborative experience and change their behaviour accordingly. It is the link between receiving feedback and acting on it, the behaviour that determines whether an organisation’s collaborative patterns improve over time or calcify into habit. In feedback networks, adaptiveness determines whether the feedback loop is actually closed. Many organisations collect feedback extensively but change nothing. In innovation networks, adaptiveness determines whether new ideas are absorbed into practice or remain permanent pilots. Adaptiveness also captures an organisation’s relationship with its own identity: can it evolve who it is, or is it trapped by who it has been?
The Paradox
Highly adaptive organisations risk losing coherence. If every team is constantly reinventing its processes based on the latest feedback, nothing stabilises long enough to be evaluated properly. Partners cannot plan around a team that changes its ways of working every quarter. Conversely, organisations that resist adaptation often do so for psychologically rational reasons, existing patterns feel safe, and change provokes anxiety about competence and status. The deepest paradox is that the teams most in need of adaptation are usually the ones least able to do it, because the behaviours they need to change are the same behaviours that define their identity and provide their sense of security.
Example: A customer service operation receives consistent feedback that its escalation process frustrates other departments. Leadership acknowledges the problem and commissions a redesign. The redesign recommends changes that would disrupt the team’s established roles and hierarchies. The team implements the changes on paper but reverts to old patterns within weeks. Two years later, the same feedback is still being given. The team is not resisting change deliberately, the old pattern is how they manage the anxiety of their work, and no one has addressed that underlying need.
Understanding the behavioural loops - everything is connected.
These eight behaviours do not operate independently. They form feedback loops: a change in one cascades through others, sometimes reinforcing the intended effect and sometimes undermining it.
Low safety suppresses openness. Suppressed openness starves information networks. Starved information networks force teams to make decisions based on assumptions rather than evidence. Poor decisions erode trust in the teams that made them. Eroded trust reduces safety further. The system spirals.
Equally, strong alignment without distributed control produces compliance rather than commitment. High engagement without adaptiveness produces activity without learning. Assertiveness without safety produces domination rather than productive challenge.
The practical implication is that diagnosing a single behaviour in isolation will almost always produce an incomplete picture. The value of this framework lies not in scoring each dimension independently but in understanding how they interact within a specific organisational context.
When using this framework for diagnosis, three questions are more revealing than any individual score:
First: where are teams positioned differently on the same dimension, and is that difference a productive paradox or a destructive misalignment?
Second: what stories do teams tell about why collaboration is difficult, and what do those stories reveal about the underlying anxieties and unspoken assumptions driving behaviour?
Third: where has the organisation attempted to improve collaboration before, and why did those efforts stall? The answer will usually point to a feedback loop that was not understood at the time.
Organisations are complex adaptive systems. They resist simplification. But they are not incomprehensible. These eight behaviours provide a shared language for seeing what is happening, understanding why, and identifying where intervention is most likely to make a lasting difference.
SHARE